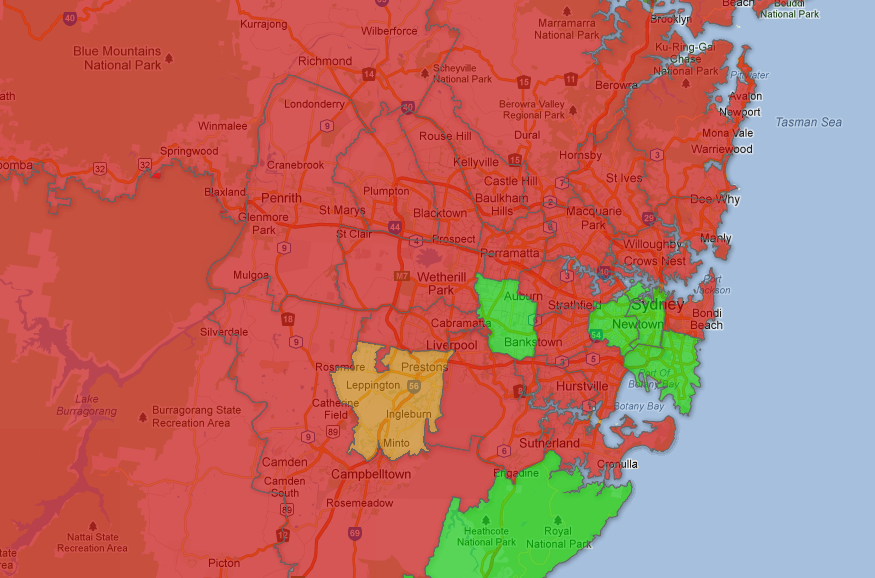
In early 2012 the House of Representatives conducted an online survey to provide a simple means for the public to voice their views on same-sex marriage. When the survey closed on the 20th of April, it had received 276,000 responses, 64.3% of them in support of same-sex marriage. However, last week the Lower House voted down the Marriage Amendment Bill 2012 42 to 98. Using Google Fusion Tables, geo data from the Australian Bureau of Statistic, and the results of the recent bill I created a map which shows how the population of each electorate was represented by their member of parliament. Red for electorates represented with a no, orange for abstained, and green for electorates represented with a yes. This very red close up of the Sydney area makes me feel very unrepresented.

Click here to see the full map.
I recognise gay marriage even if my government doesn’t. On the up side, the following 42 members of parliament believe that two people who love each other should have the right to marry. Thank you for representing me even if you’re not my representative :)
- Mr Albanese
- Mr Bandt
- Ms Bird
- Ms Brodtmann
- Mr Butler
- Mr Champion
- Mr Cheeseman
- Mr Clare
- Ms Collins
- Mr Combet
- Mr Dreyfus
- Mrs Elliot
- Ms Ellis
- Mr Garrett
- Mr Georganas
- Mr Gibbons
- Mr Gray
- Ms Grierson
- Mr Griffin
- Ms Hall
- Mr Jenkins
- Mr S Jones
- Dr M Kelly
- Ms King
- Ms Livermore
- Ms Macklin
- Mr Marles
- Mr Oakeshott
- Ms Parke
- Mr Perrett
- Ms Plibersek
- Ms Rishworth
- Ms Roxon
- Ms Saffin
- Mr Shorten
- Mr Sidebottom
- Mr S Smith
- Ms Smyth
- Mr Snowdon
- Mr C Thomson
- Mr Wilkie
- Mr Crean
-----BEGIN PGP SIGNED MESSAGE-----
Hash: SHA256
- ---
title: Let them eat wedding cake
author: Greg
layout: post
permalink: /2012/09/let-them-eat-wedding-cake/
comments: True
categories:
- Human Rights
- politics
tags:
- ABS
- fusion tables
- Gay marriage
- House of Representatives
- politics
- ---
In early 2012 the House of Representatives conducted an [online survey][1] to provide a simple means for the public to voice their views on same-sex marriage. When the survey closed on the 20th of April, it had received 276,000 responses, 64.3% of them in support of same-sex marriage. However, last week the Lower House voted down the [Marriage Amendment Bill 2012][2] 42 to 98. Using Google Fusion Tables, geo data from the Australian Bureau of Statistic, and the results of the recent bill I created a [map][3] which shows how the population of each electorate was represented by their member of parliament. Red for electorates represented with a no, orange for abstained, and green for electorates represented with a yes. This very red close up of the Sydney area makes me feel very unrepresented.
[ ][3]
Click [here][3] to see the full map.
I recognise gay marriage even if my government doesn't. On the up side, the following 42 members of parliament believe that two people who love each other should have the right to marry. Thank you for representing me even if you're not my representative :)
* Mr Albanese
* Mr Bandt
* Ms Bird
* Ms Brodtmann
* Mr Butler
* Mr Champion
* Mr Cheeseman
* Mr Clare
* Ms Collins
* Mr Combet
* Mr Dreyfus
* Mrs Elliot
* Ms Ellis
* Mr Garrett
* Mr Georganas
* Mr Gibbons
* Mr Gray
* Ms Grierson
* Mr Griffin
* Ms Hall
* Mr Jenkins
* Mr S Jones
* Dr M Kelly
* Ms King
* Ms Livermore
* Ms Macklin
* Mr Marles
* Mr Oakeshott
* Ms Parke
* Mr Perrett
* Ms Plibersek
* Ms Rishworth
* Ms Roxon
* Ms Saffin
* Mr Shorten
* Mr Sidebottom
* Mr S Smith
* Ms Smyth
* Mr Snowdon
* Mr C Thomson
* Mr Wilkie
* Mr Crean
[1]: https://www.aph.gov.au/Parliamentary_Business/Committees/House_of_Representatives_Committees?url=spla/bill%20marriage/survey.htm
[2]: https://parlinfo.aph.gov.au/parlInfo/search/display/display.w3p;query=Id%3A%22legislation%2Fbillhome%2Fr4749%22
[3]: https://www.google.com/fusiontables/DataSource?docid=1KNh9Nj1SKU2uidyzFHZwg9fN-5K19vgG6wb3KR4#map:id=4
-----BEGIN PGP SIGNATURE-----
iQIzBAEBCAAdFiEESYClA57JitMYg1JBb8nUVLEJtZ8FAmIc1zAACgkQb8nUVLEJ
tZ+e9g/8D+x0sk2xVusJ/+kO0k7X7WTeW9FJHzXIJBnDb/lDIshTBaLleNXPAmGc
Fx3QeAU3fquM18Tz+r0ndHvoDajdMguIySQ9LE1RtIsOpW0lWcSiR0i/gWl7nQgi
rZ9/Fo/91y9MwYmM0vdSi3xba1hwsQSypNWawjo129zKiEQglJ3BcSJZ7nw1Xc80
pH213k/KkXwMFOYu3CI2s8P9nmwHXfG8u2uZJHdFre3bs5sLizB9UgIdVC40lYg1
iQHYWloKN6CXmoCgi/JvfLCimiiafqgaQ06e4Mo7IcmlPBcexboh7DmOXmf36bkK
2/hVSQ3rz64LzdGJTdNrjf99v/1UHztC1ruUqLTlCAXJ+lHsnfBaPr43/ZdnBDR1
eBOi5gtspTh4hCfkGhNYceSsdxsfTO61QO3cQD1xRR5OTuD0oU/Gp/t82tcZ4X+M
pkEvFvVOoqYCB+WCVwmo9meuGXoMIfae6wZE4RR3kLhQqaeQFEvK+7AHsg3T2fYD
DjyZEQcmrz08M4QwJ4gRrloBAyAaSo8X18AB+sCI1gd+NNrTe9UQhfWEMS11Ei4g
mZd5vIVHvUkyNrJtuvM9BM6pAhqyYzxz4ZUez7+PYGsVS+DIbX6nxsDTL7jq2JAa
E0zgCH0mF6GthWHCf2LtMDf+zu9bRW5XCmRM7LwL6i/Ns7iYYBc=
=F5gC
-----END PGP SIGNATURE-----
Tags:
ABS, fusion tables, Gay marriage, House of Representatives, politics
